Where PB meets public health, we find data for decision-making.
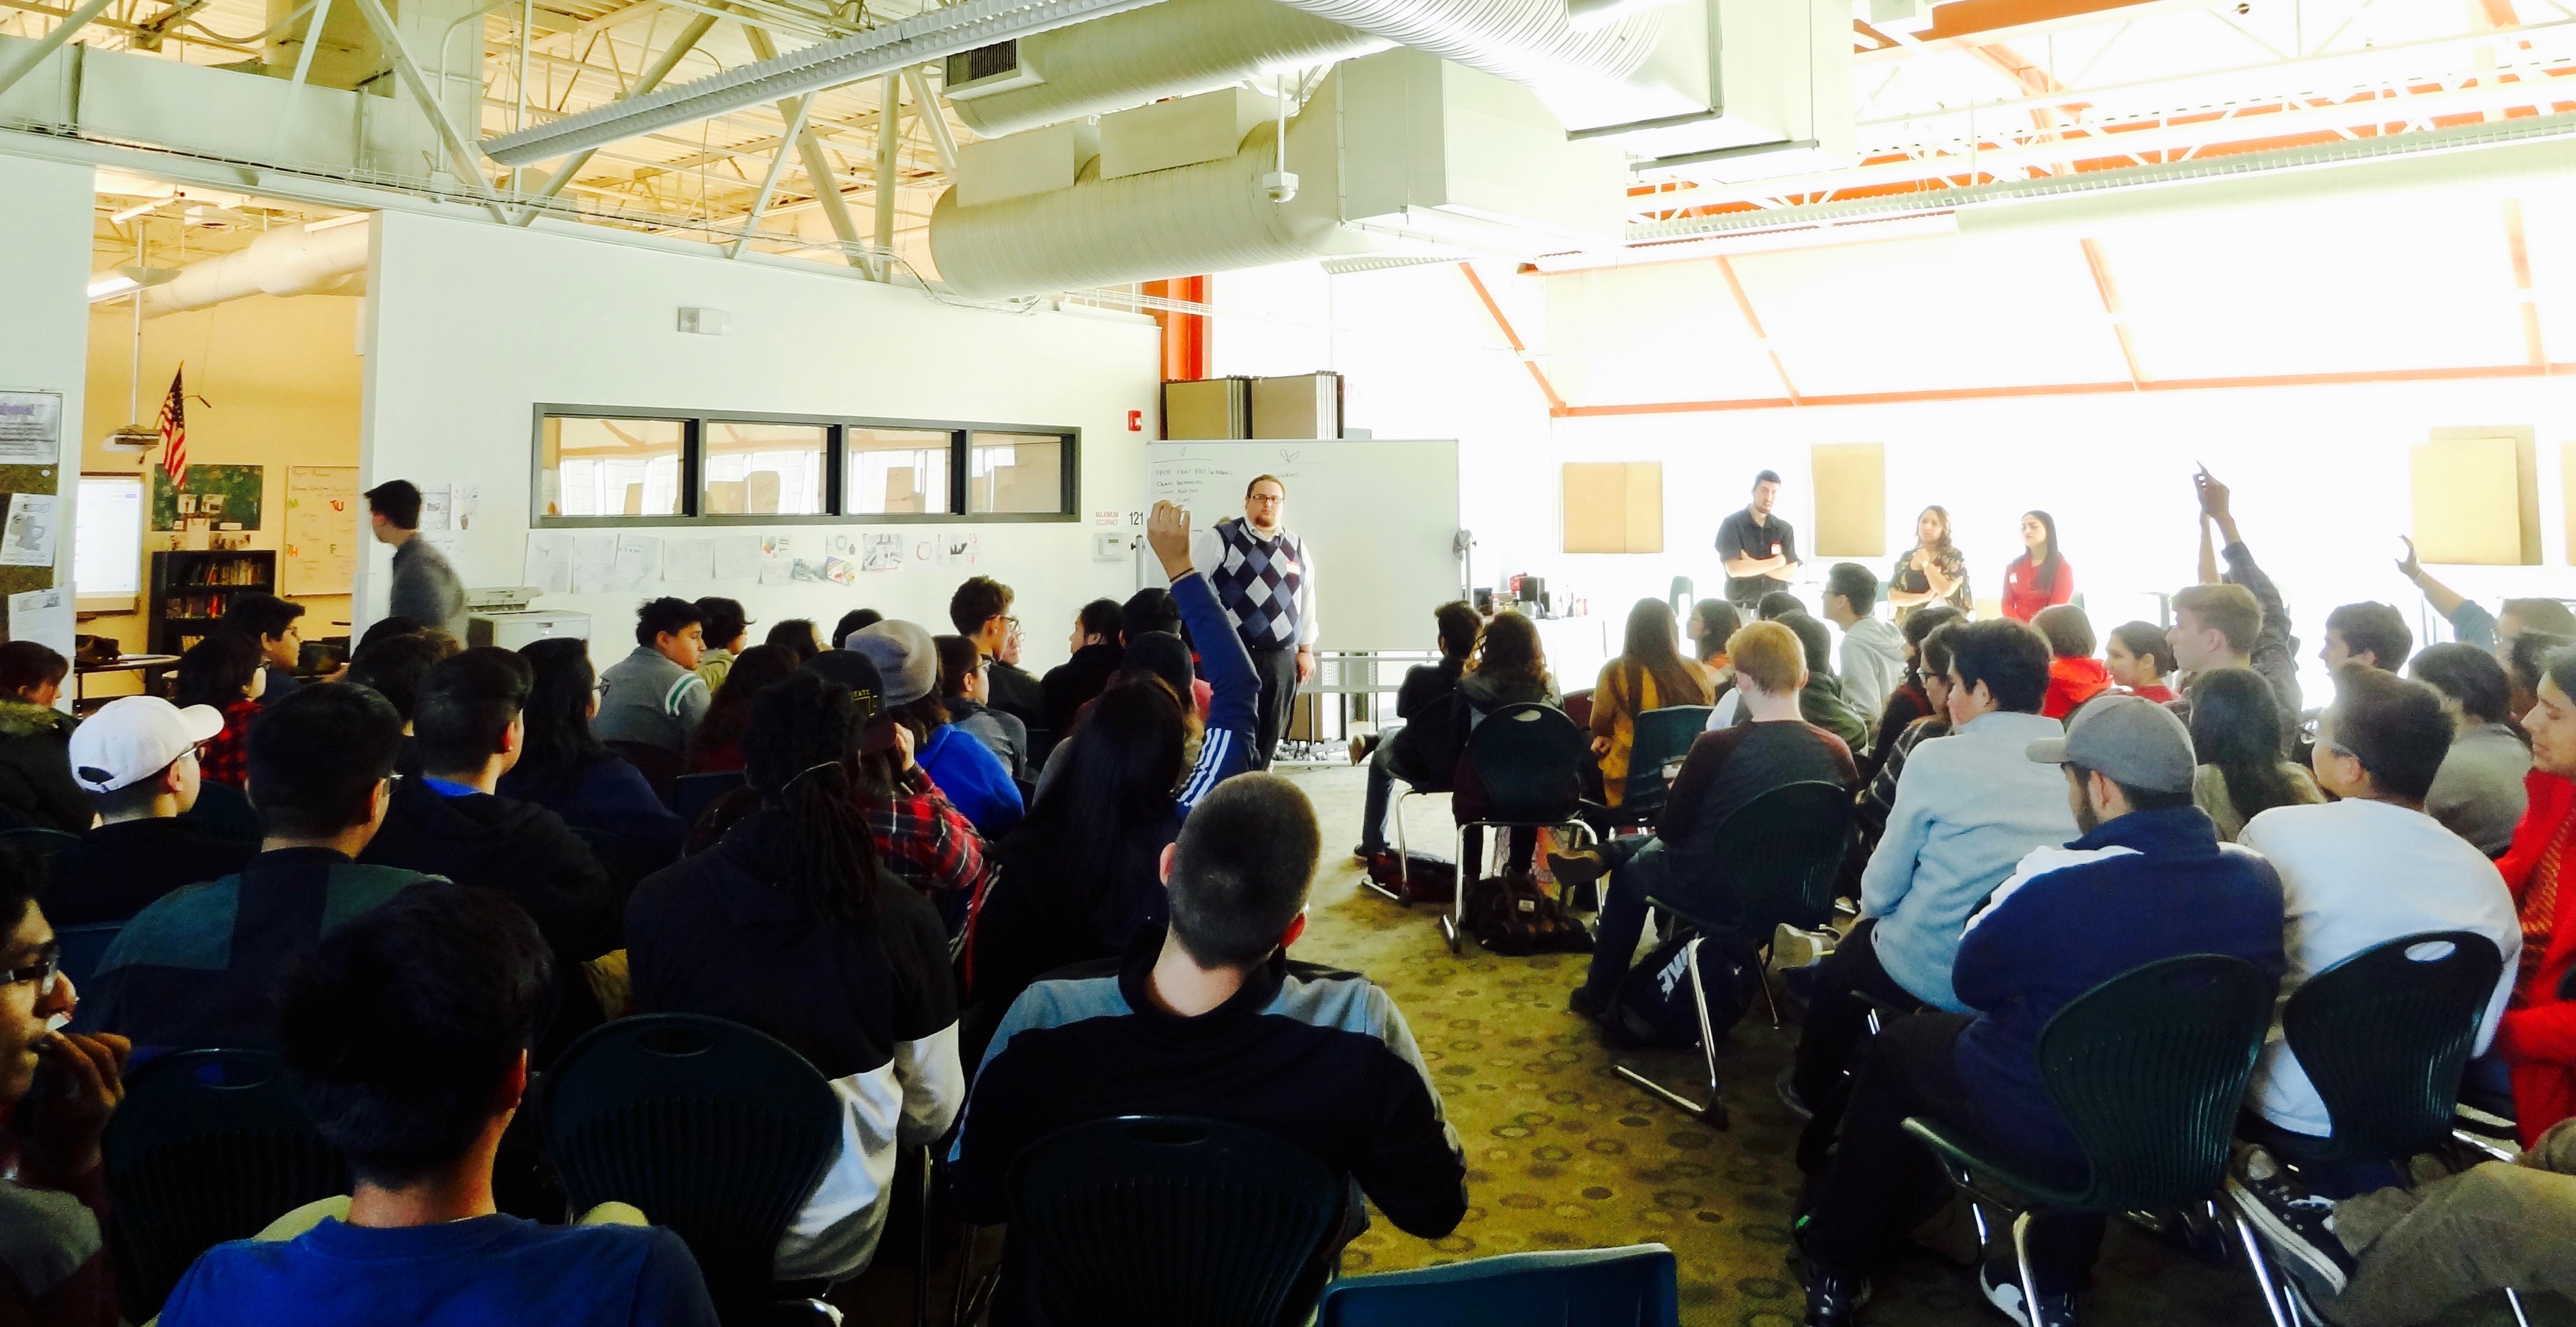
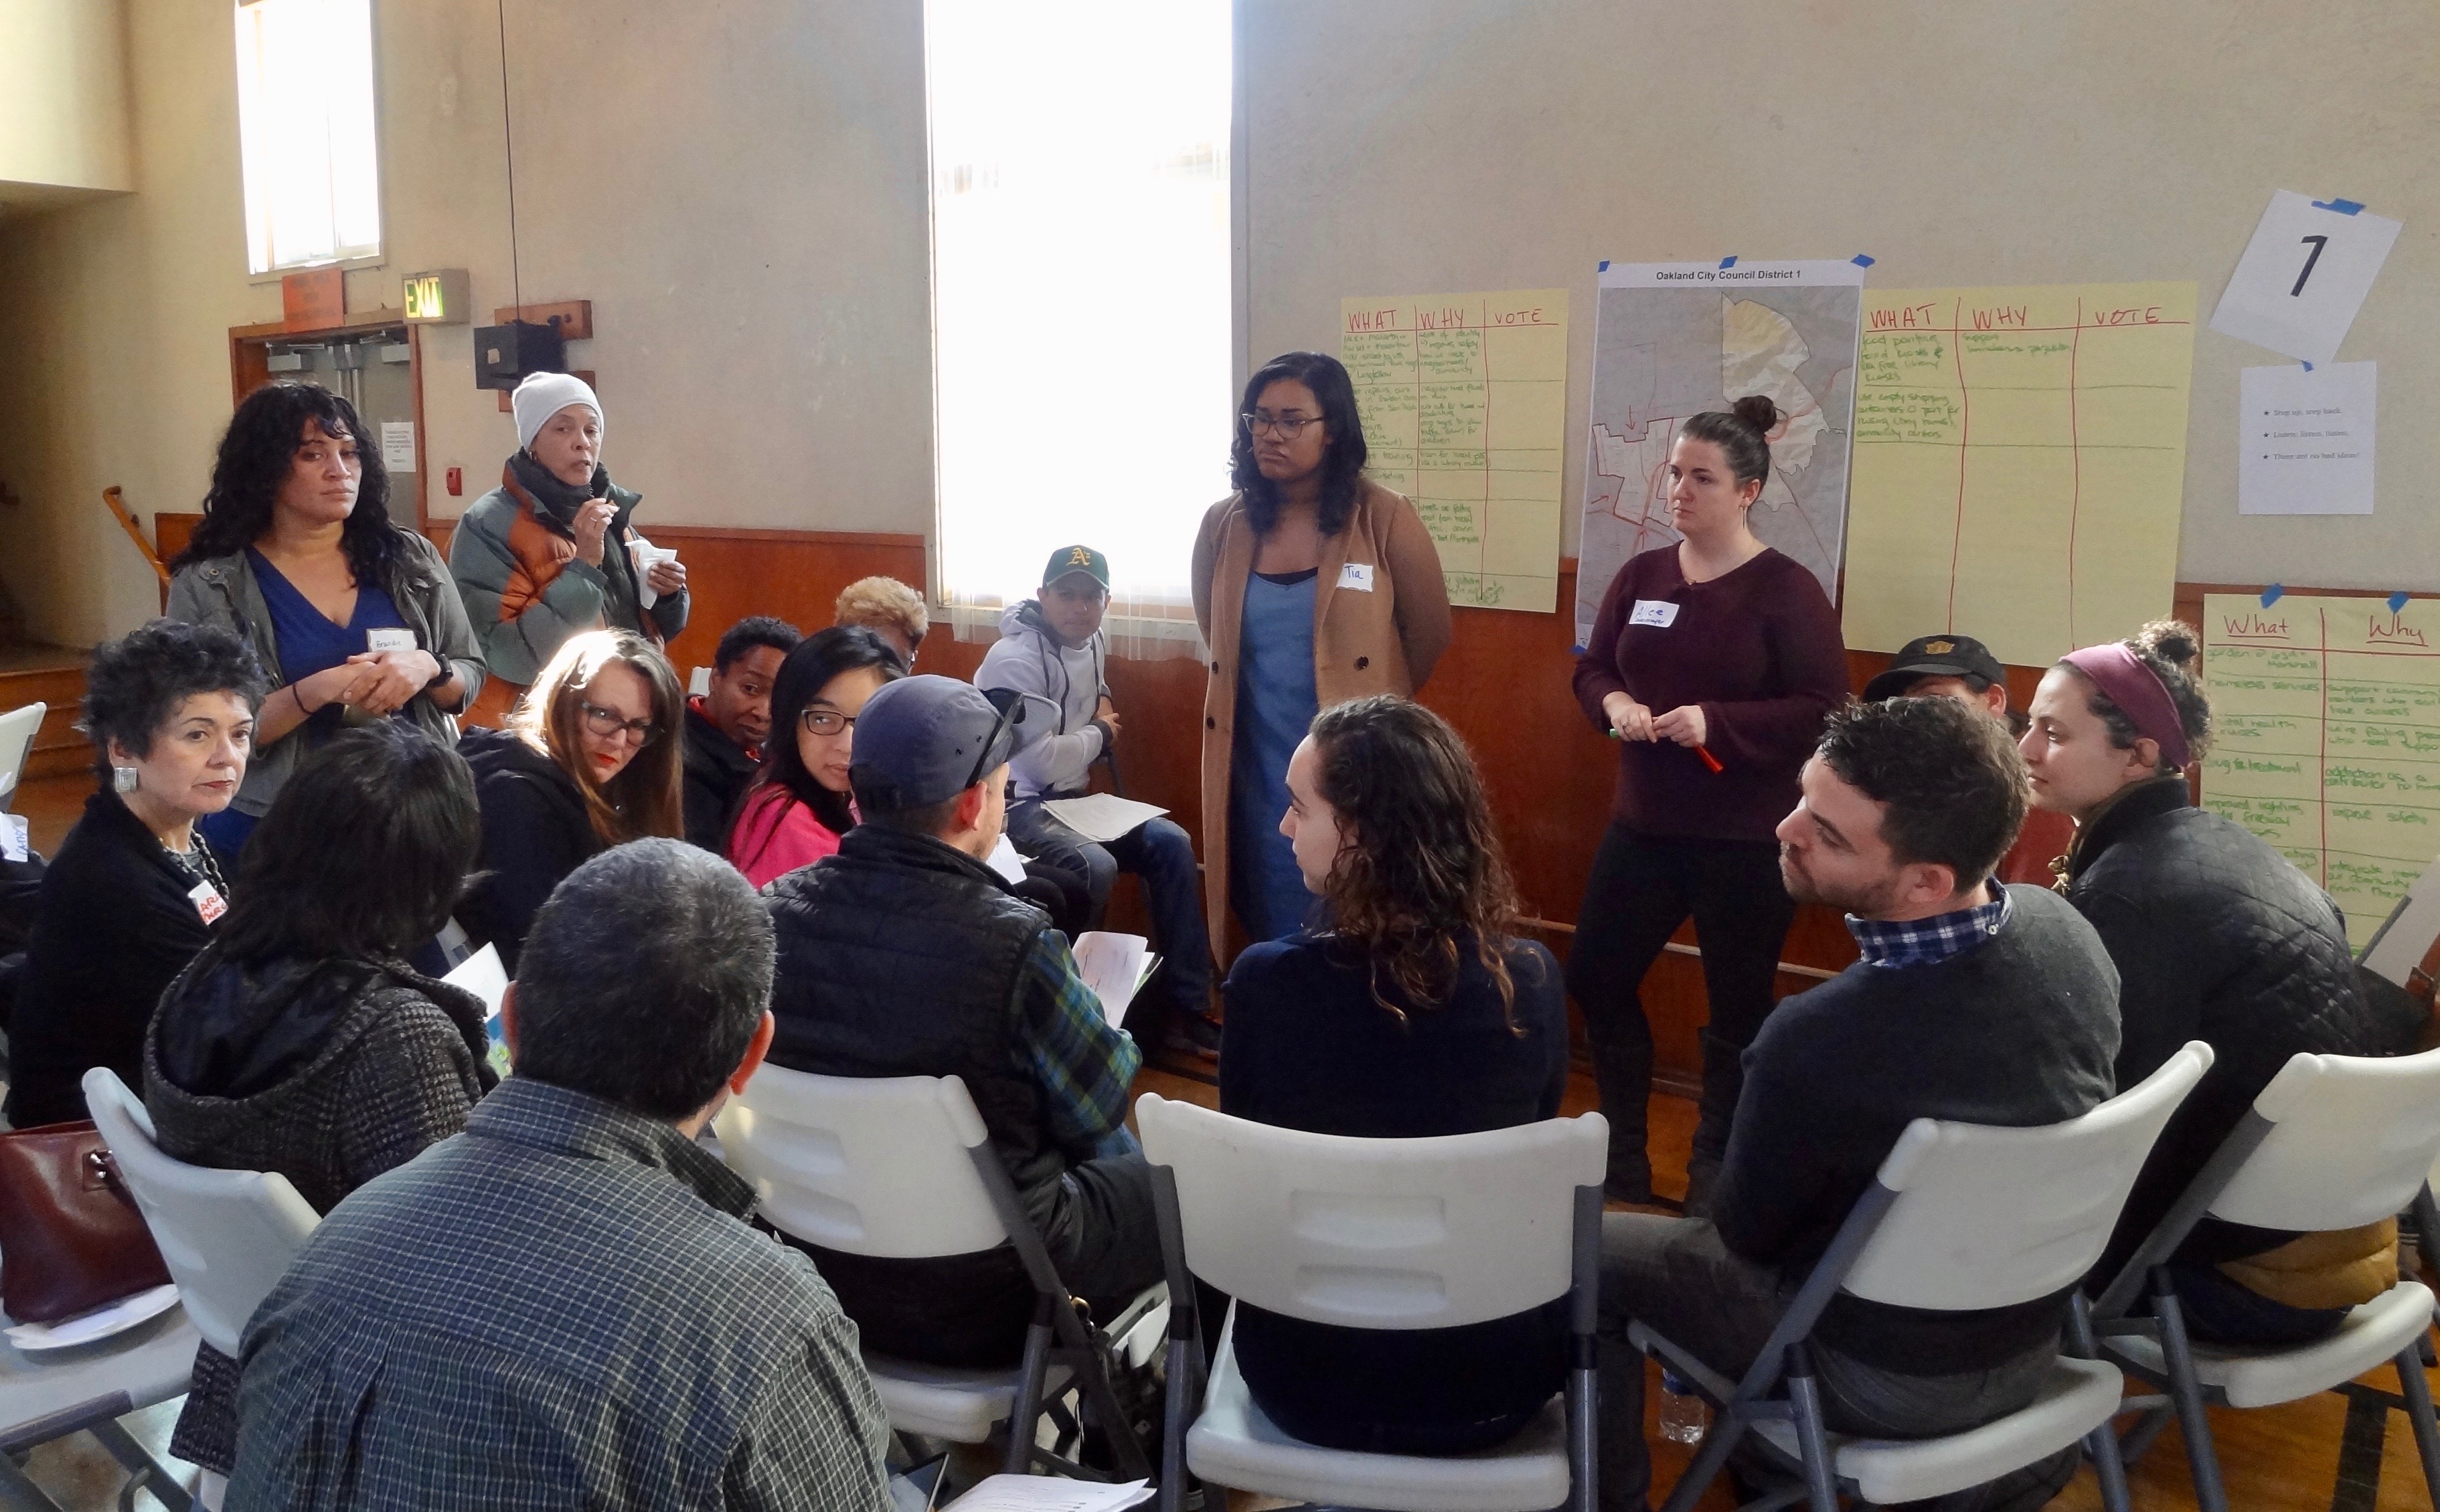
Andrew entered the idea collection assembly confidently; he came prepared with stories, justifications, and excitement backing his proposal for more dog parks in his neighborhood. After eagerly sharing his idea in a breakout group, he started to notice repetition among other ideas shared; multiple community members in his group raised concerns regarding schools. They shared challenges with funding for schools, and offered project ideas to improve experiences for students, teachers, and parents.
As someone without any children, Andrew’s eyes swelled with surprise as he learned that schools were in a state of crisis in his district. Over the course of the assembly, he began to realize that the need for PB projects related to schools was much greater than the need for projects related to dog parks. In this instance, Andrew encountered a question of equity—a question that caused him to look a little closer to see the ways resources were unfairly divided in the district, and the ways this unfair distribution could impact a student’s educational trajectory and overall wellbeing.
Continuing to work in participatory budgeting (PB) promised to raise similar questions for Andrew by challenging what he previously accepted as “normal” in thinking about divisions of resources and opportunities—and the consequences they have on our wellbeing. Andrew left the idea collection assembly humbled and ready to volunteer as a Budget Delegate on the Schools and Education Committee—where he would help turn ideas about schools into project proposals to go on the ballot.
As a Budget Delegate, Andrew soon discovered what many of us already know: talking about equity is hard. While conversations about equity are often challenging, frustrating, and uncomfortable, these conversations spark critical discussions in our everyday lives, and in our work with PB.
At the Participatory Budgeting Project (PBP), one way we help people level through questions of equity is by directing them to relevant civic data to help them understand community needs beyond their individual lived experiences. However, simply pointing our Budget Delegates towards sources of data isn’t enough; there’s just so much data out there, and data that people can’t understand is useless. Directing Delegates to explore data typically leaves everyone lost in endless spreadsheets, maps, and questions:
Where should I start with this data? How do you know how to interpret and use it all? How do I know this is reliable data? How can this data help our community?
Well-meaning people without useful and user-friendly data often make decisions and ask questions that are limited by their own experiences, even if they want to do better—like Andrew, and all Budget Delegates. When compassionate and curious people use data to understand equity-led decision-making, they develop projects that meet a community’s deepest needs.
PBP believes in the power of using data to contextualize equity. We want to help make the large amount of available data meaningful for Budget Delegates, and we hope to ground Delegates in thinking about equity to expand their understanding of where the greatest needs are within their communities. Localized civic data can point to social impact opportunity areas and help determine the need, feasibility, and scope of a PB project to ultimately inform decisions in PB.
What we created: Data for Delegates
PBP supporters, when asked how they wanted their donations spent in “PB2”—a PB process for PBP—highlighted data as a priority; supporters voted for their donations to be spent on creating a resource to help Budget Delegates in PB processes across North America access, understand, and utilize data in their PB project proposals—and so we created exactly that.
After reviewing more than 50 data resources and tools, we’re thrilled to share our initial picks of what we’ve identified as the top seven resources and tools to help inform understandings of community health and equity in engaging ways!
We present, the Data for Delegates web portal:
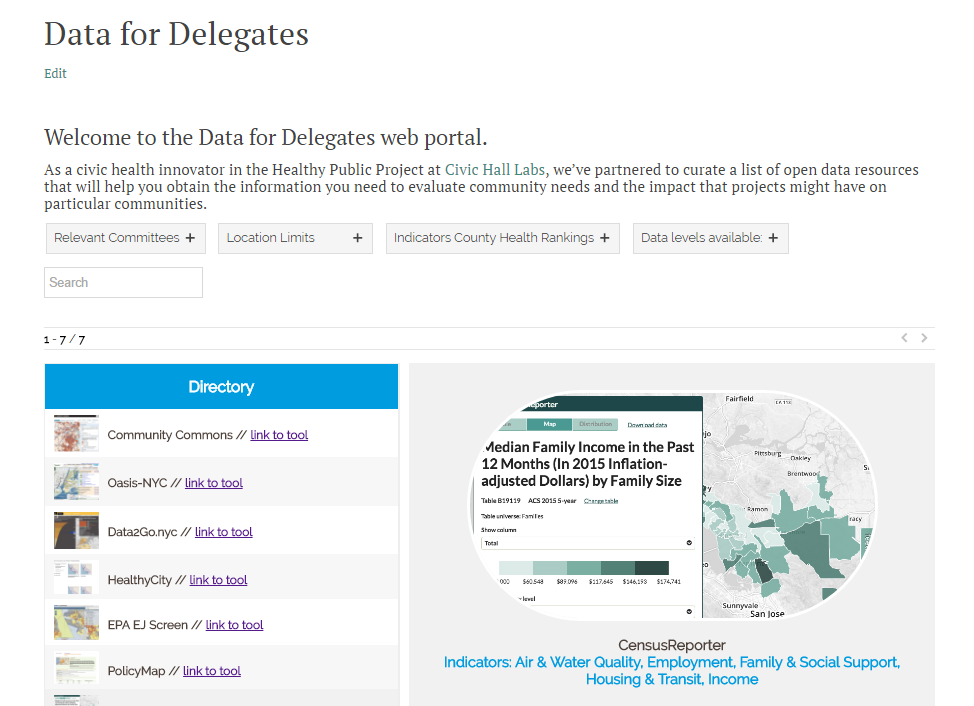
Check out the Data for Delegates web portal here!
What we learned: introducing a public health framework
The Robert Wood Johnson Foundation (RWJF) states it simply in their report on A New Way to Talk About the Social Determinants of Health: there’s an “integral relationship between our health and where and how we live, learn, work and play.”
With the support of Civic Hall Labs in the Healthy Public Project, we grounded our thinking around data by adopting a social determinants of health framework as a proxy for how we think about—and talk about—equity. We’ve adopted this framework so that we have a pathway for how to work through data and help others answer questions about how to access and use data; this framework is not partisan, and it’s not limited to the worldview of a Budget Delegate.
Examining the social determinants of health provides a useful framework for thinking about equity, and especially so in this political moment. We’re appreciative of our partners at Civic Hall Labs for sharing their expertise, questions, and resources with our team at PBP, and we’re excited to share what we’ve learned with you!
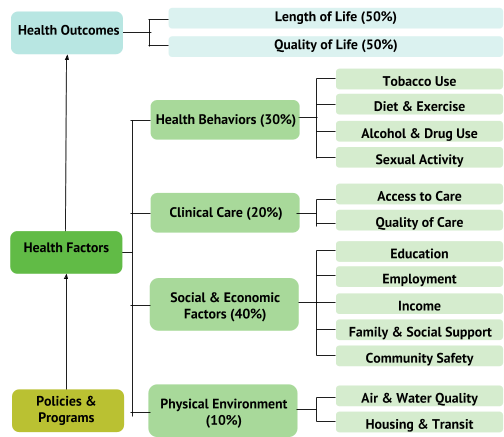
We focused on two metrics drawn from the County Health Rankings to work with data by thinking about equity through the lens of social determinants of health: (1) people (with data on employment, income, family and social support, and community safety) and (2) projects (with data on education, environment, and housing and transit). We used these metrics as a taxonomy to categorize resources.
We hope these user-friendly and open data resources will help delegates in PB processes across North America work through the question: “How do you take data, and then use it to propose a project for PB?”
Next steps for you!
Check out our Data for Delegates web portal, try out the tools we’ve suggested, and send us stories of how you’ve used these top resources—and any others you use and love!
Share your stories on this feedback form and on social media using #ParticipationLab; we can’t wait to hear your feedback and how you use data to further support the critical work of understanding and lifting up equity in PB and beyond.