
Participatory budgeting thrives when community members have access to data that informs their decisions and inspires them to think about their surroundings.
As participatory budgeting (PB) grows, its impact on the physical landscape has become increasingly apparent.
From parks and libraries in Long Beach, California to streets and schools in Toronto, people across North America have used PB funds to transform their surroundings to meet public needs.
As a result, each cycle involves lots of data–project locations, voter turnout figures, district boundaries–that can be effectively presented on a map. At PBP, we’re excited to build maps that illustrate PB’s impacts in an accessible, collaborative manner.
Cities across North America and Europe are utilizing geographic software as a tool for PB implementation, evaluation, and advocacy, demonstrating its ability to enhance each stage of the budgeting process. It can be as simple as showing where PB has taken place. In Scotland, this map relies on crowdsourced data to show the geographic scope of PB and summarize each locality’s unique experience. it provides a useful overview of how PB has taken place in Scotland.
Maps can also play a role in PB implementation.
Using maps during idea collection–the phase where citizens brainstorm ideas for public projects–helps voters better understand how proposed projects will affect their surroundings. While idea collection is typically done in person, citizens in New York, Oakland, and Greensboro can add their ideas to a collaborative map, view existing ideas, and provide feedback to their peers.
These tools enhance accessibility by allowing participants to contribute and engage remotely; they also reveal spatial patterns that would be lost in a spreadsheet. They can show which areas have been underrepresented in terms of project proposals: citizens, upon recognizing this, can submit new ideas that serve the community equally.
Maps can also be used after voting has taken place to identify successfully funded projects. Voters in Chicago and Paris who are interested in PB’s local accomplishments can see the exact locations of winning projects from prior years, alongside updates on their implementation. Meanwhile, budget delegates–volunteers tasked with finalizing a ballot from citizens’ ideas–can use these maps as guidelines when assessing the feasibility of project ideas. An enduring visual record of PB’s successes helps all participants; maps such as these do so in an informative, clear manner.
PBP has a number of mapping projects of our own.
With the help of CARTO, we’re developing interactive maps from our internal data to more effectively demonstrate PB’s scope and impact. By making this information easily attainable, we hope citizens will build on our work with analyses and visualizations of their own. With numerous open data sources (including our own Data for Delegates) and accessible mapping software available to the public, it’s never been easier for community members to visualize location data in their own way.
 We’ve redesigned our website’s Case Study map, which highlights prominent PB processes from around the world. It includes information that PBP has collected since 2011, summarizing each location’s experience with PB while providing data points such as voter turnout and money allocation.
We’ve made the underlying dataset available to the public, allowing anyone to conduct analyses or build maps of their own. This map will continue to grow as PB spreads from city to city–let us know if we’re missing your local process!
One of our winning PB2 projects is a map that tracks project funded by PB in North America.
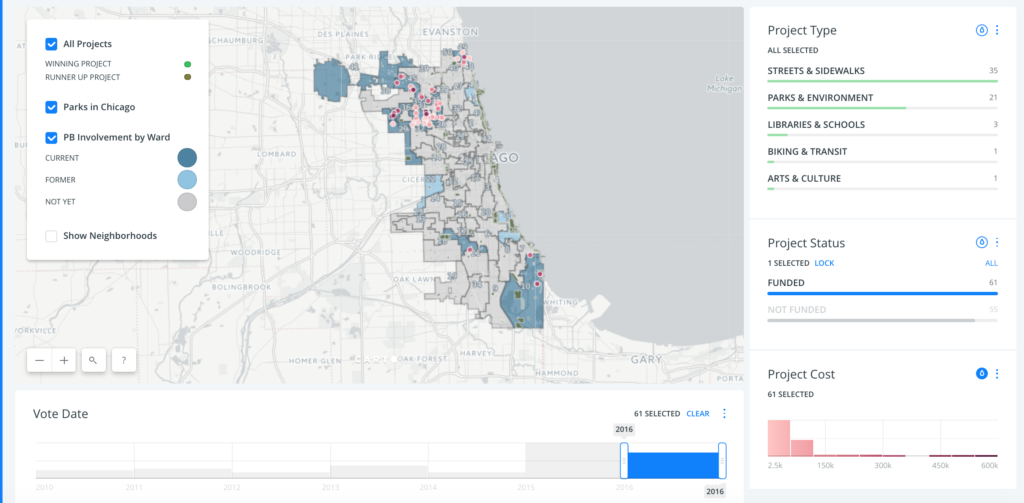
We’ve started by mapping each PB project that has appeared on the ballot in Chicago since 2010. This map includes interactive tools that allow viewers to filter projects by cost, category, and year; these were designed to inform budget delegates as they assess proposals but also should be of interest to voters. Once completed, this map will provide a comprehensive view of PB’s local impact. Stay tuned!
We hope that these maps will not only provide information but also inspire participants to visualize PB in their own way. Public maps, be they local, national, or global in scope, remain essential tools as we build an open, collaborative democracy.