
![]()
 Good data is being used to make better participatory budgeting (PB). In Greensboro, they’ve used the previous cycle’s data to set goals and to figure out where to direct outreach to maximize participation – particularly of underrepresented populations. Research from the New York PB Research Board and the Community Development Project at the Urban Justice Center shows that PB helps get young people interested in political and civic life, and that low-income people and people of color were more likely to hear about PB through existing community organizations, door knocking, or their kids’ schools.
Pursuing an innovation in democracy like participatory budgeting (PB), brings on two sets of challenges (1) convincing people that trying the new idea is worthwhile, and (2) experimenting to understand what works and what doesn’t. Good data is key for both making the (1) political case that PB is a net benefit for those involved, as well as figuring out how to (2) improve PB – all while considering that every community is different.
Key Metrics
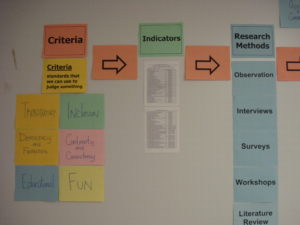
The North American PB Research Board has Key Metrics to answer some of the crucial questions we all have about how well participatory budgeting is making democracy better. The metrics are standardized so that we can make comparisons, and speed up the race to the top and win more and better PB.
How can the Key Metrics be used to make the political and improvement cases for PB?
Let’s try an example from one of the Metrics, “Number and percentage of PB voters who are eligible to vote but did not vote in the most recent local election.”
How could this be used?
(1) Political case
When lobbying for a new PB process or expanding an existing process, specific data makes a stronger case:
- “In this time of low voter turnout and high voter apathy, 10% of the voters in PB process were people who don’t normally vote in regular elections”
- “We’re reinvigorating civic life in our community 10% more than our neighboring district, and 15% more than our rival city!”
(2) Improving PB
In order to get better, it helps to be able to measure how we have done in a way that’s consistent and repeatable, for example:
- “A disproportionately high number of the voters in our PB already vote in normal elections. We should improve our outreach strategies to bring in more people who are traditional non-voters.”
But that sounds hard…
Sure, getting and understanding data has given lots of really smart people challenges. For example, even Albert Einstein said, “Information is not knowledge.” — just getting surveys out and back isn’t enough. Do it thoughtfully and the data you gather will be all the more useful!
6 tips to help make data collection a little easier
- Use the Public Agenda evaluation kit: Public Agenda has created a toolkit on collecting the key metrics, and data strategies, so you don’t have to reinvent the wheel.
- Survey Smarter: The main idea of field of statistics is that looking at a small piece can tell you about the entire process. This “sample” works better if you try to make it representative of the group you’re interested in as possible. With good sampling methods, you can get better results, while handing out fewer surveys – rather than trying to give a survey to everybody.
- Partner with local universities to help you out: PB evaluation could be a great project for an undergraduate or graduate survey methodology class. Opportunities for publishing the results in academic journals is like candy for academics and make it a win-win.
- Pro tip: Going through the school’s Institutional Review Board (IRB) is a hurdle, but is better if you want to publish. Also getting a Memorandum of Understanding (MOU) between the researchers and the implementers can help you get clear on when and how the people collecting the data will share the source data and any analysis back with the implementers.
- Use digital tools: Digital survey tools can make data entry easier. If you can get access to tablet computers, then you can increase your chances of getting a survey filled out in-person, and decrease the time you need for data entry afterward. Check out PBP’s growing bank of digital tools for more ideas.
- Streamline your data: Before you start take a moment to think about how you’re going to manage the data. How does data come in? What needs to happen next? Check out PBP’s Information Management Tip Sheets, and our Info Pro Flow visualization to give you some ideas.
- Ask for help: While PB is relatively young in North America, there’s a wealth of expertise you can draw on from research that’s already been done. The PB Network and the North American PB Research Board have great places to get knowledge.
Now that you’re armed with six tools to make it easier to collect data, start looking for ways that your own PB might be improved, as well as how you can overcome political obstacles and make it grow.
Want to learn more about integrating data and equity considerations into your PB work? Check out the upcoming Participation Lab call schedule here.